The Windows Driver Kit (WDK) 5
Starting WinDbg
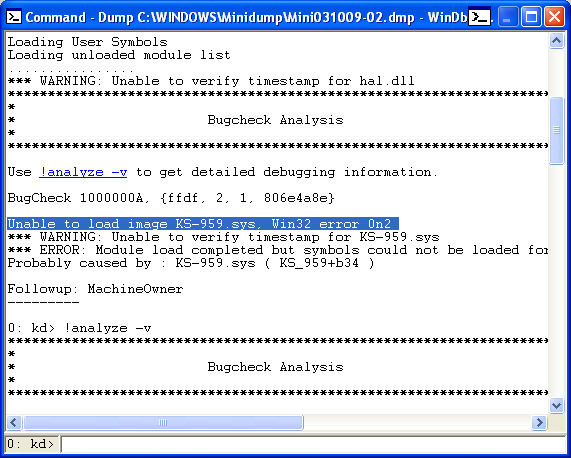
To analyze a dump file, start WinDbg with the -z command-line option:
windbg -y SymbolPath -i ImagePath -z DumpFileName
The -v option (verbose mode) is also useful. If WinDbg is already running and is in dormant mode, you can open a crash dump by selecting the File → Open Crash Dump menu command or pressing the CTRL+D shortcut key.

Opening the Windows Crash Dump file
When the Open Crash Dump dialog box appears, enter the full path and name of the crash dump file in the File name text box, or use the dialog box to select the proper path and file name. When the proper file has been chosen, click Open.
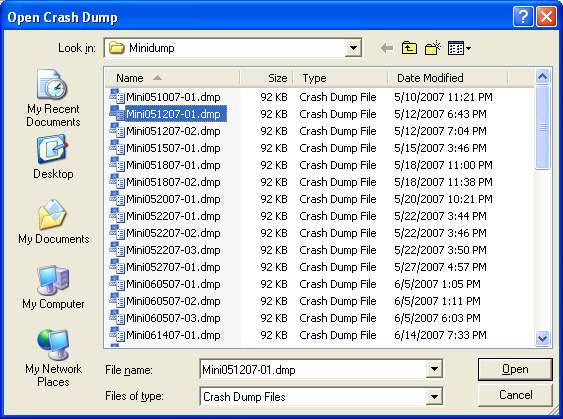
Selecting the Windows mini Crush Dump file
You can also open a dump file after the debugger is running by using the .opendump (Open Dump File) command, followed with g (Go).
Dump files generally end with the extension .dmp or .mdmp. You can use network shares or Universal Naming Convention (UNC) file names for the memory dump file. Well, it will take a long story to provide examples on how to debug either the user mode or kernel mode and why not you try the following links by Windows device driver developer for more information.
- A Crash Dump analysis tutorials.
- Windbg basic tutorials.
- Tips on how to analyze strange Crash Dumps and uninstall the Windows hidden drivers.
< Windows Driver Kit (WDK) 4 | Windows Driver Kit (WDK) Programming | Win32 Programming | Windows Driver Kit (WDK) 6 >